visualizing information

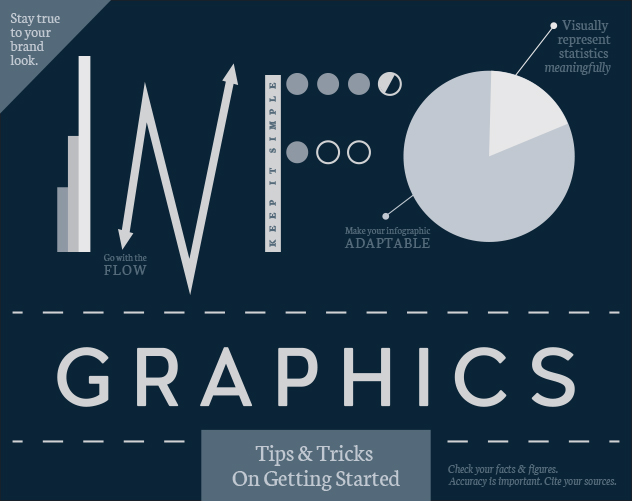
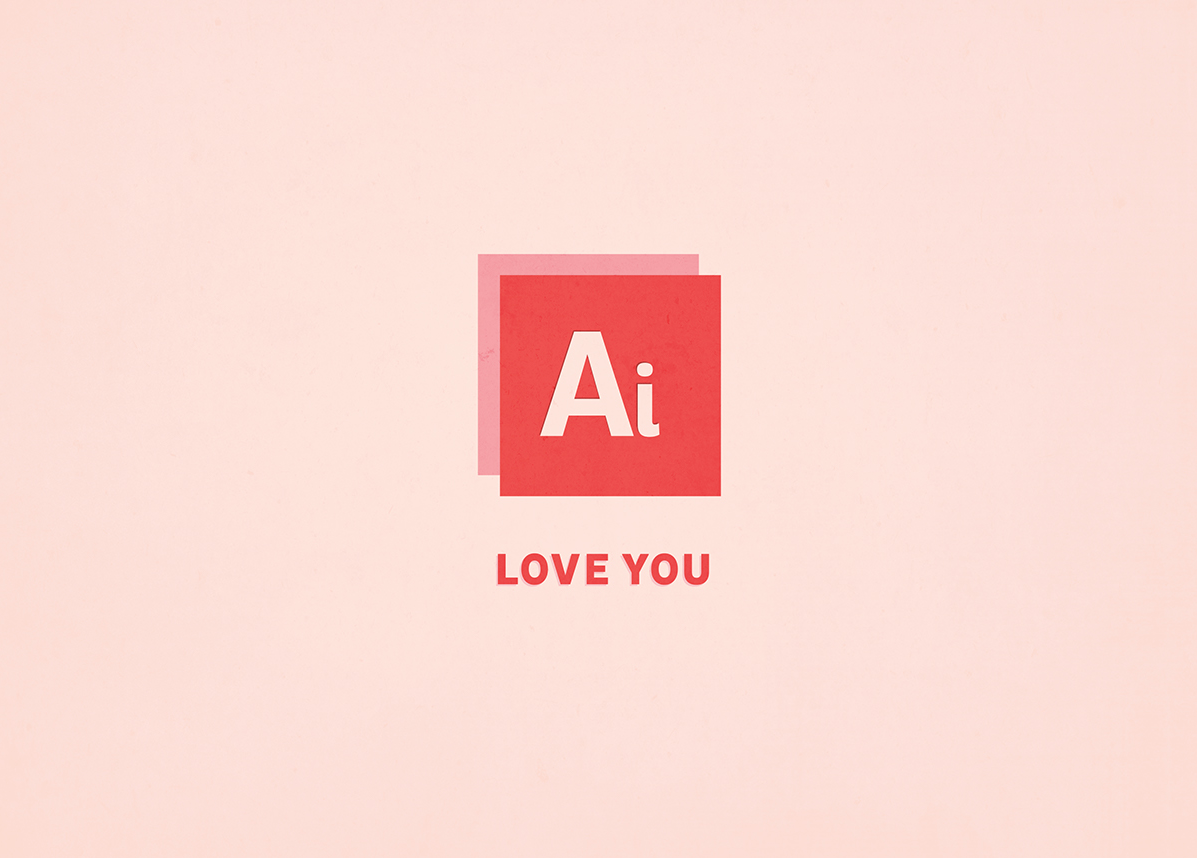
Valentines for the Graphic Designer in Your Life

VALENTINES FOR THE GRAPHIC DESIGNER IN YOUR LIFE   Happy Valentine’s Day from us at ocreations. Here are some of the best Valentine’s Day cards we found this season for the graphic designer in your life…   Found on cargocollective.com. Click on photo to go to source. Found on behance.net. Click on photo to go to source. Found on behance.net. Click on photo to go to source. Found on behance.net. Click on photo [...]

By |2019-03-15T06:11:22-04:00February 14th, 2018|

Tips for a Meaningful Infographic

TIPS  FOR A  MEANINGFUL  INFOGRAPHIC   Many people claim to hate statistics. What most people mean by that is, they don’t enjoy running statistical analyses, but people love to see/hear the final outcome of statistical analyses and love to be able to put numerical values to data. One trend that combines information (statistics) and visual graphics, are infographics. Info + graphics = infographics. However, the ability to understand the given data/information, and make it visually appealing is one for artists [...]

By |2019-03-15T06:11:22-04:00February 9th, 2018|

Title

Go to Top